

Case study
HVAC Membership Lifecycle Tracking
How one of the largest home-services companies in the country learned to count its own memberships — a Power BI semantic model tracking the full lifecycle of 150,000+ HVAC service agreements, built in-house without a data warehouse behind it. Diagrams use illustrative data.
The problem
ARS / Rescue Rooter sells Home Service Plan (HSP) memberships — recurring service agreements that bundle seasonal HVAC maintenance into an annual or auto-renewing monthly plan. Memberships are the backbone of recurring revenue: they keep technicians in customers' homes twice a year and feed the replacement-system pipeline.
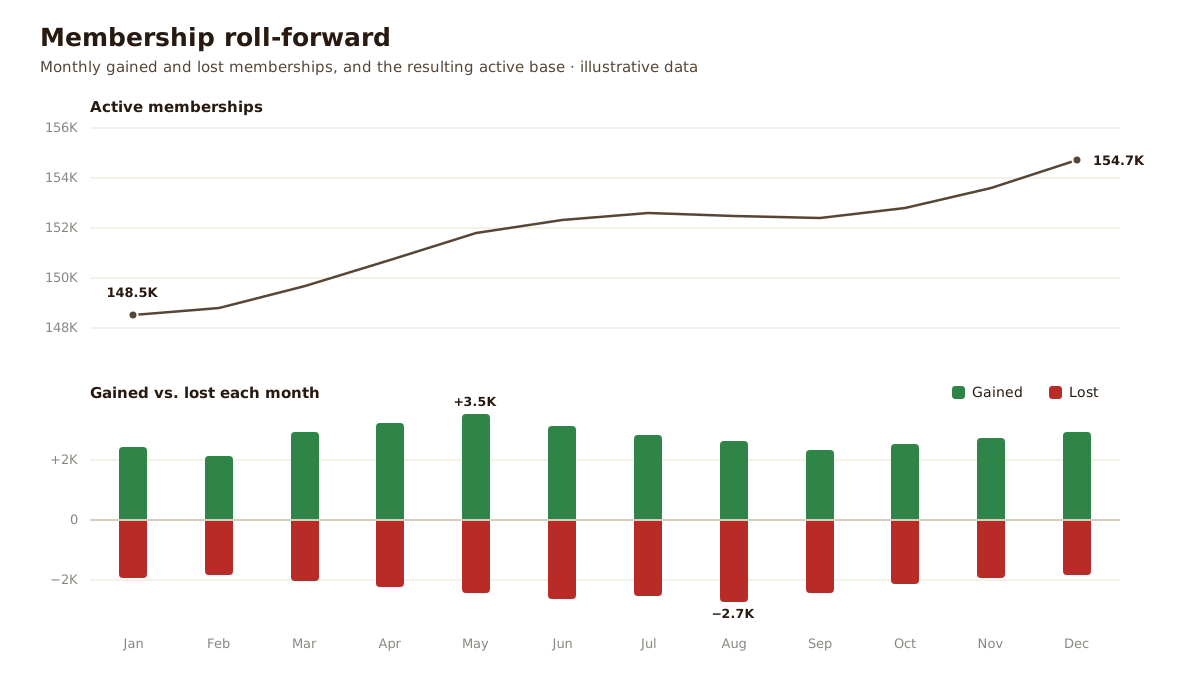
Leadership wanted a simple monthly answer: how many memberships did we gain, how many did we lose, and how many are active right now? Nobody could give one. Counts in the existing reports disagreed with the field-service system, every department defined "a member" a little differently, and historical questions — how many members did we have last March? — were unanswerable, because the source system only ever knew the present. Counting turned out to be genuinely hard:
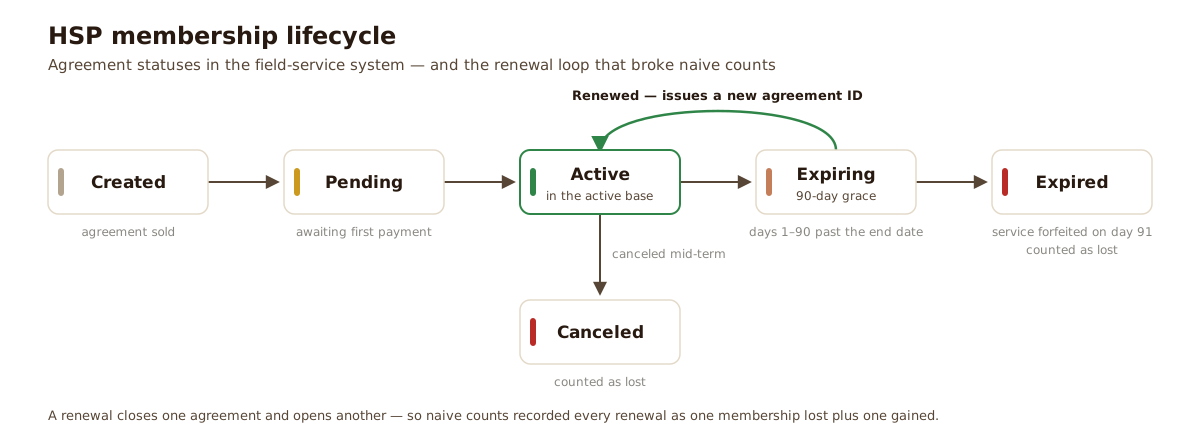
- No single definition of "active." Agreements past their end date entered a 90-day grace period. Operations considered an auto-renewing customer in grace still active; accounting considered the unused service forfeited on day 91 and recognized the revenue. Both were right — for their own purposes — and the reports had never picked a side.
- Renewals looked like churn. Every renewal closed the old agreement and opened a new one under a new agreement ID. Counted naively, a loyal customer renewing for their fifth year registered as one membership lost and one gained.
- Pending wasn't active. New agreements sat in a pending state until the first payment posted — but legacy members who paid by check had no payment-profile record at all, so no single field separated "paying member" from "signed up and never paid" across plan generations.
- Two kinds of agreement. Perpetual plans auto-renewed monthly; legacy plans ran annual terms. Anniversary dates shifted when customers renewed early, so even "when does this membership end?" had edge cases.
How it was delivered
- Process discovery — walkthroughs with the people who actually ran memberships day to day: how a service call gets booked against a plan, how accounting ties completed visits back to agreements, and how deferred revenue moves when a membership is used, renewed, or forfeited.
- Pinning down the definitions — working sessions with operations and accounting to map raw agreement events (created, posted, renewed, canceled, expired) to business statuses both sides would sign off on. The 90-day grace period argument got settled once, in the model, instead of re-argued in every meeting.
- Dimensional design — a proposal for a membership-status history dimension (slowly changing, type 2) reviewed with the BI team before any build: effective and expiration dates plus a current flag on every status change, so point-in-time questions would have real answers.
- Build — SQL shaping extracts from the raw landing tables, Power Query conforming multiple source systems into unified models, and DAX carrying the lifecycle logic and roll-forward measures.
- Reconciliation — iterating until the report's counts could be traced back to the field-service system and explained, so the numbers earned the trust the old reports had lost.
What was built
- One agreed set of status definitions — new, active, pending, renewed, canceled, expired — mapped from raw agreement events and signed off by operations and accounting alike.
- A membership-status history dimension — a slowly changing dimension (type 2) with effective and expiration dates and a current flag, so "how many active members did we have in any month" became a point-in-time lookup instead of a guess.
- Agreement lineage — calculated columns linking each agreement to its successor at the same location, so renewals count as retained customers rather than churn, and true losses split cleanly into expired vs. canceled.
- A monthly roll-forward in DAX — beginning balance + gained − lost = ending balance, reconciling every month, with gains split into new vs. renewed and a 90-day early-warning view of memberships approaching their end date.
Built without a warehouse
There was no data warehouse behind this report. The modeling that would normally live in one — slowly changing dimensions, agreement lineage, point-in-time history — had to be designed into the Power BI semantic model itself, straight over raw landing tables. Harder to build and easy to get subtly wrong, which is exactly why the status definitions were pinned down with the business first. It shipped without waiting on a data-platform project that didn't exist yet.
The outcome
- A single trusted answer to gained, lost, and active — for any month, current or historical — across 150,000+ memberships nationwide.
- Leadership tracking monthly retention trends and spotting the top-performing membership plans driving recurring revenue.
- Status definitions that operations, accounting, and BI all agreed on — the disagreement between reports and the source system stopped being a standing agenda item.