
Method case study
Operational Reporting, Mockup to Production
How reports get built at Red Hare: a mockup the client can argue with in the first week, a working prototype on sample data, and only then the production build. The expensive engineering starts after the layout is agreed — not before.
The problem with the usual way
The standard sequence for a BI project is: write a requirements document, build for weeks, then show the client a nearly finished report. The client sees their report for the first time at the moment changes are most expensive. Requirements documents don't prevent this — people are good at describing what they do, and bad at predicting how they'll react to a page of charts they've never seen. So the feedback that should have shaped the design arrives as rework instead.
The fix isn't a better document. It's showing something that looks like the finished report while it still costs almost nothing to change.
The method
- Requirements conversation — a working session on the decisions the report needs to support: who reads it, what they need to act on, and which numbers have to be trusted for that to happen.
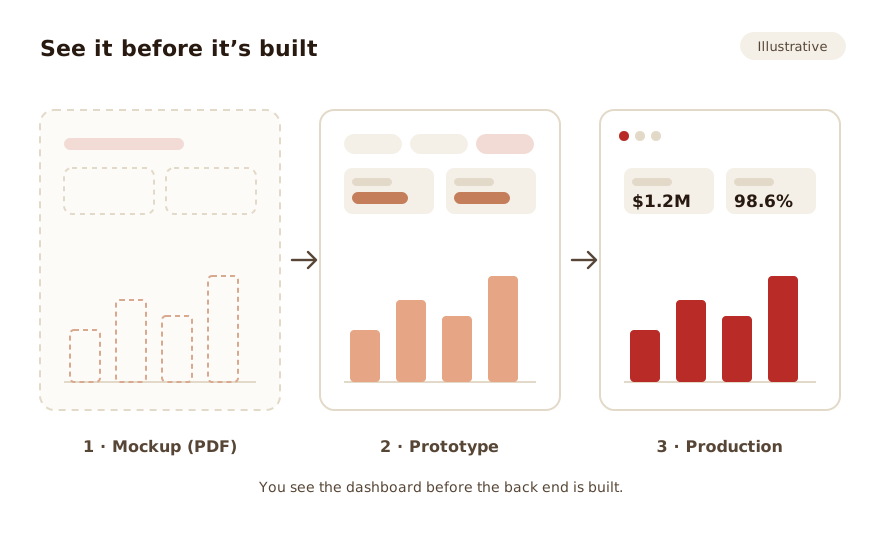
- Mockup, in days — a PDF mockup of the report built on sample data, drafted with AI assistance so it takes days instead of weeks. It's deliberately disposable: cheap to change and easy to argue with. Layout, priorities, and definitions get settled here, before any engineering money is spent.
- Interactive prototype — the real Power BI report, running on static sample extracts. The client clicks through actual filters and drill-downs and finds the gaps a PDF can't show, while the back end is designed in parallel.
- Production build — the data model, transformations, and refresh schedule built to serve a report whose shape is already agreed. No guessing about what the model needs to support.
- Feedback triage — post-release requests get sorted deliberately: quick fixes now, larger ideas onto a roadmap. The project ends on time instead of dissolving into scope creep.
Where AI fits
The mockup stage is fast because AI compresses the drafting — first-pass layouts, sample datasets, and revisions that used to take a week of back-and-forth happen in a working session. That's the pattern for AI across Red Hare projects: it makes the mechanical parts cheap — drafts, scaffolding, documentation — while the judgment calls stay human. Which metrics earn a spot on the page, how a definition gets settled, what the client actually meant: no model decides those.
The result isn't a different kind of deliverable. It's the same production-grade report, reached with less wasted build time — and a client who was never surprised by what got delivered.
What this buys the client
- You see the end result first. The report you sign off on in week one is the report that ships — same layout, same priorities, real data behind it.
- Changes happen while they're cheap. Moving a chart on a mockup costs minutes. Moving it after the data model is built costs real money. The funnel front-loads the arguing.
- The back end is built once. Because the report's shape is settled before the model is designed, the engineering serves known requirements instead of guesses.